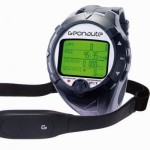
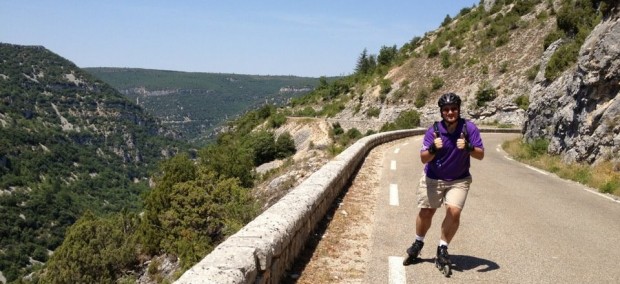
 Last year, I bought a GPS tracker watch, Kalenji Keymaze 700, to record my skates (and bike) trips and training sessions. As usual, the software bundled with the watch was windows only. I found a small python script made for a similar tracker, that extracts GPX files. But I found nothing satisfying to view and analyse the GPX files under linux, so I hacked a small javascript app to display my logs.
The basic functionnalities are :
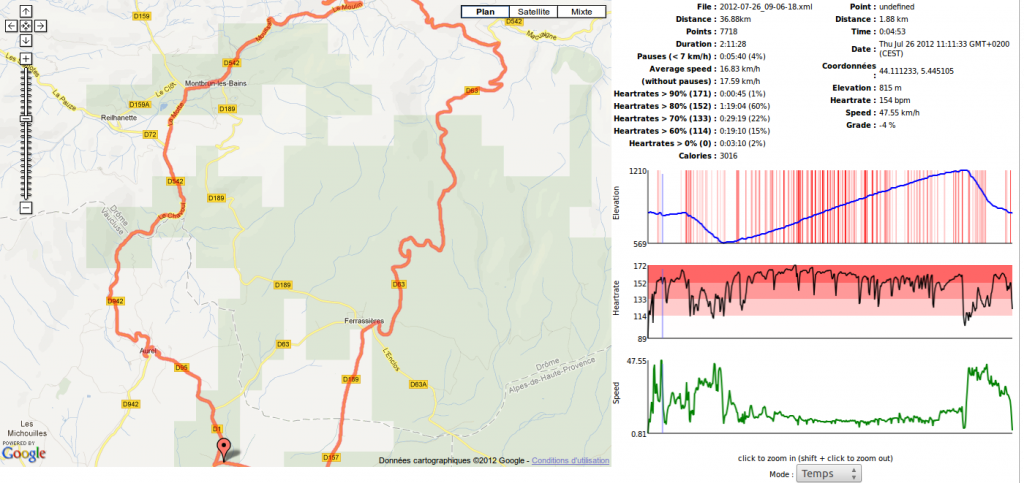
– display the track on a google map view
– show global informations about the session (time, average speed, distance, etc…)
– show altitude, speed, and heartrate graphs
– show instant informations when hovering graphs, and point the location on the map
– allow zooming on the graphs
– graphs can be based on time or distance
– detect pauses (when the speed is below 7 kph) and take them in account to compute average speed
Some things I want to improve in the futur :
– compute instant speed (speed is actually recorded by the watch, but many GPX files lack this kind of informations)
– get altitudes from Google or any other online service (altitudes reported by GPS are often imprecises)
– smooth speed and altitude to wipe out errors
– use openstreet map instead of the deprecated google map api v2
– allow an offline mode
– show colors on the track to display informations (ie: speed, heartrate, altitude or grade)
– allow to draw a virtual finish line for loop tracks, and use that line to count laps, and display laps statistics.
– add a settings screen and find a way to save settings for each file
You can view the script in action here (and also view some of my trips 😉 )
You can download the script here. Update : You can now find it on GitHup
As usual, this script is provided under the GPL v3 licence. I hope you’ll find some good way to use it. Let me know 😉


Commentaires récents